VP DOTA2
A cross platform game data analytics tool for Dota 2 players.

Timeline
Mar 2019 - Apr 2019

My Role
Product Manager,
UX Designer

Tools
Figma, Adobe XD, Illustrator, inVision

Skills
Research, Persona, Journey Map, Sitemap, Prototyping
Background
Dota 2 is the most played multiplayer online battle arena (MOBA) video game on Steam. Enthusiasts of the game use Dota 2 analytics tools to track their game statistics and identify information relevant to help them improve.
As one of the leading e-Sports and online gaming platforms, VPGame wanted to break into the Dota 2 analytics market, attracting players from different regions and skill levels. There are currently several Dota 2 analytics tools available in the market, with only a few capturing majority of the market share. Our goal was to create an engaging user experience that would entice players to try our tool. So our initial design problem was: "What could be improved upon for the current Dota 2 analytics tools?"
Design Overview
In 3 weeks, I designed VPDota across both mobile and web platforms, with an aim to help players effectively understand their performance, and ultimately improve their skills.


Design Process

Discovery phase consisted of me interviewing stakeholders to understand the project purpose, project goal, target audience, success indicators, strategies and constraints. After gaining clarity on the initial project direction, I conducted market and user research to define problem, Minimum Viable Product design goals, and success metrics. During the design phase, I held brainstorm sessions and sketched out promising ideas. I created sitemap to clarify product structure and moved to Figma to build low-fi wireframes and high-fi mockups. I conducted usability testing after each round of prototyping and iterated design based on findings. After that, I tested colors on different devices and documented interface specifications. Finally, I helped engineers with implementation through making appropriate compromise in design based on engineering constraints, reviewing API documents to make sure all the data needed were available, tracking development progress and testing products.
Research
After I did some online research to better understand Dota 2 and Dota 2 gamers, I moved on to our main competitors' websites, Dotabuff and OpenDota, to see how our tool can provide unique value. Through my competitive analysis, I found that both Dotabuff and OpenDota provide rich data. But are these data overwhelming to users?


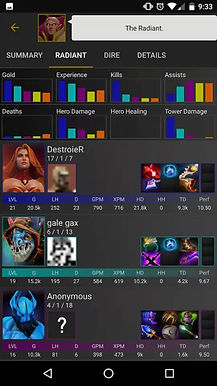
Figure 1. Dotabuff Match History
Figure 2. OpenDota Hero Stat
To validate the problem and dig more potential opportunities the market left to us, I did both qualitative and quantitative research to gain more user insights. I conducted user interviews with three enthusiastic Dota 2 gamers with different skill brackets along with usability testing on Dotabuff and OpenDota. And after analyzing my qualitative research data, I made a short survey with Google Forms (received 101 responses) to validate findings and lessen bias. I concluded these major findings based on my research.
Users like to see rich amount of in-depth data so that users can find any types of information they seek.
Generally, users use Dota 2 analytics tool during 3 phases to improve their play: before the game, during the game and after the game.
Pure statistics are not intuitive for users to find out the information they want.
Mobile Dota 2 analytics tools are lack of data and hard to use.
Meet the User

Journey Map

Design Requirements
Redefined Design Problem:
How might we help users navigate through a tremendous amount of data so they can quickly find the information they are looking for?
MVP Design Goals:
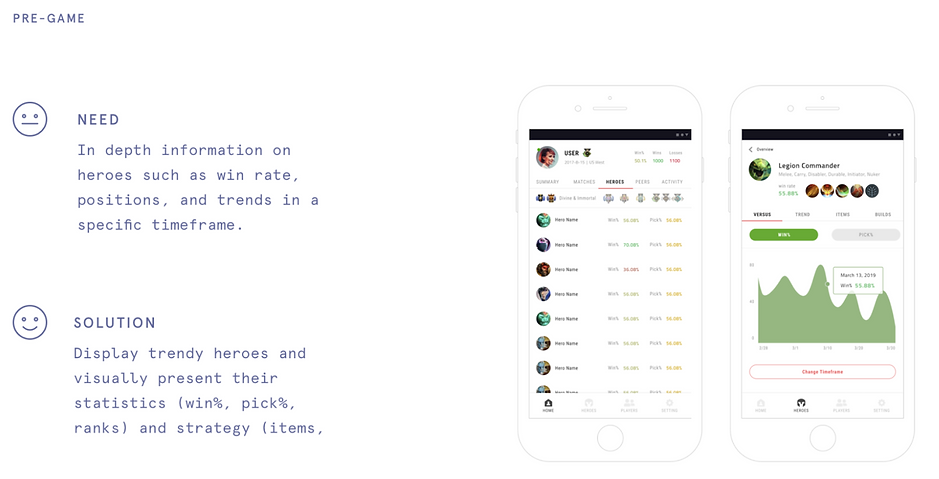
Gamers will see visualized and organized game data analytics.
Gamers will access to our Dota 2 analytics tool through both web and mobile platforms.
Gamers will find relevant game data analytics before the game, during the game and after the game.
Success Metrics:
The improvement of the speed users complete their tasks.
Sitemap
I presented the persona, journey map and design requirements to the stakeholders and my team to gain feedback from different perspectives. Then I held a brainstorm session with the whole team.
I organized promising ideas we came up with into a sitemap. I then had a meeting with my manager and engineers to decide what will be in the 1st iteration and what will be in our future iteration. This was one of my crucial steps in the process because by communicating with dev at this time of the process, I was able to understand the technical constraints.

Prototype
I iterated the design process through making low-fidelity sketches, wireframes and high-fidelity prototypes. I took critical feedback from the team and conducted usability testing after each round of design. After finishing the mobile design, I moved on to the desktop version and repeated the prototyping process.

Final Product
Take on the Victory Path with an in-depth yet intuitive stats platform.